Benchmark[et]ing ultra-low-power with EM
Vendor data sheets might specify that an ultra-low-power MCU draws (say) 700 nA @ 3 V when in its "deep-sleep" mode. Very nice – but until we factor in our application workload, we have no way to truly assess the impact of these MCU specs on overall energy efficiency.
The impact of software
Unless our MCU stays completely inert – in "shutdown" mode, awaiting reset – embedded application software has undue influence over the system's total power consumption.
Targeting the most resource-constrained (ultra-low-power) MCUs, many EM applications will follow a relatively simple, cyclic design pattern:
| wakeup from deep-sleep mode |
| acquire data from the environment |
| analyze this data using an algorithm |
| transmit results (wirelessly) to a gateway |
| re-enter (low-power) deep-sleep mode |
With application requirements dictating active duty-cycles ranging from once-per-second down to once-per-day, minimizing elapsed time between steps through would surely lower total power consumption – by re-entering "deep-sleep" that much sooner.
In practice, steps and involve MCU peripherals performing I/O operations at application-defined data-rates – an ADC sampling at 15 kHz, a radio transmitting at 1 Mbps, etc. With little to do while awaiting I/O completion, software often idles within a "lite-sleep" mode.
Typical MCU power specs
MCU lite-sleep mode typically consumes under 1 mW of power and enables interrupt response times of less than 1 μ . But while the CPU idles, other peripherals such as the radio could remain active – in fact drawing more power than the CPU would alone.
By constract, MCU deep-sleep mode might consume well under 10 μW of power – but wakeup times could stretch to 100s of μs . While any active peripheral can awaken the CPU when idling, "deep-sleep" mode only powers a limited set of MCU elements (GPIOs, RTCs) which can trigger wakeup interrupts.
Finally, MCU active mode – when the CPU fetches and executes instructions – will typically draw power at levels expressed as μW / Mhz . Standard industry metrics like EEMBC CoreMark® help normalize performance claims by individual MCU vendors; a port of this popular benchmark to the EM platform has already begun.(1)
- Stay tuned for more information in 1Q24.
Once the MCU returns to its "active" mode – and the application finally does some useful work – the impact of software on total power consumption boils down to the number of instructions the CPU must fetch and execute. But how can we best quantify this impact ???
Energy (J) – not power (W)
As software practitioners, we need to measure joules and not watts. Only by focusing on total power consumption over a period of time can we begin to appreciate the oversized  impact our code can have on overall energy efficiency.
To illustrate, let's consider a basic BLE beacon application that advertises packets once-per-second – following the simple cyclic design-pattern outlined earlier. To make matters more interesting, we'll compare two different BLE stacks otherwise running on the same MCU: (1)
- NXP's KW39/38/37 long-range BLE MCU
a legacy BLE stack – written in C and supplied by the MCU vendor
a prototype BLE stack – written entirely in EM and coming available in 2024
To begin, let's look at a pair of power profiles which report the amount of energy ( in μJ ) each stack consumes within a one-second time window. Spoiler alert – EM wins !!! (1)
- We captured these profiles using a Joulescope JS220 energy analyzer – worth 10x its cost, but maybe 10x over budget.
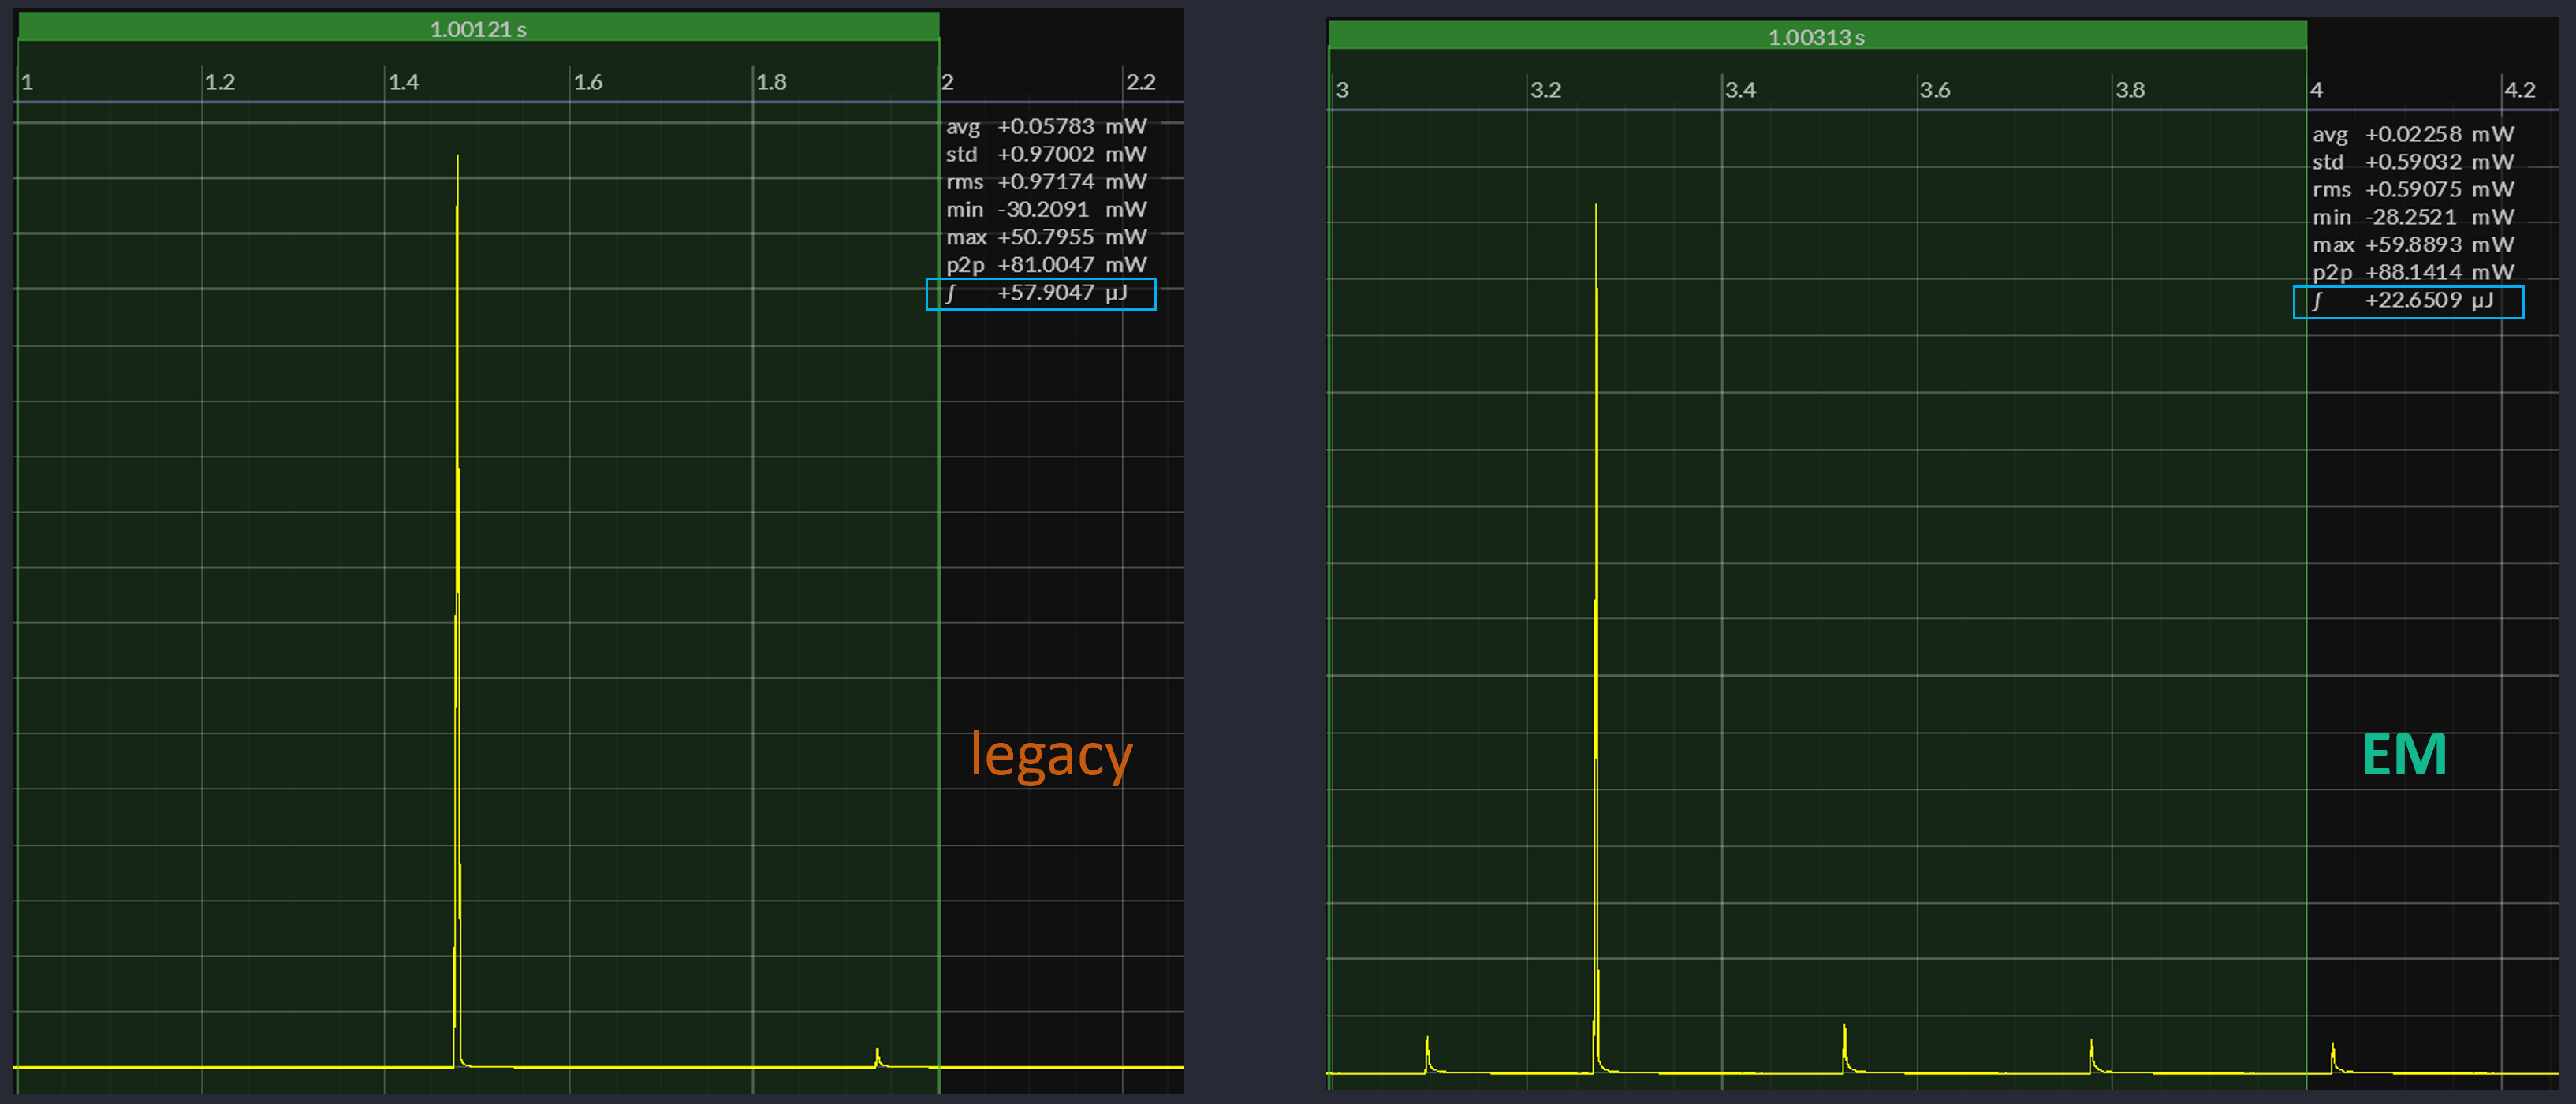
Based on these actual values, the legacy and EM stacks could (in theory !!) advertise for 1.3 and 3.2 years respectively using a CR2032 coin-cell battery with 220 mAh of charge. But why does one stack significantly outperform the other ??? To answer that question, let's zoom-in:
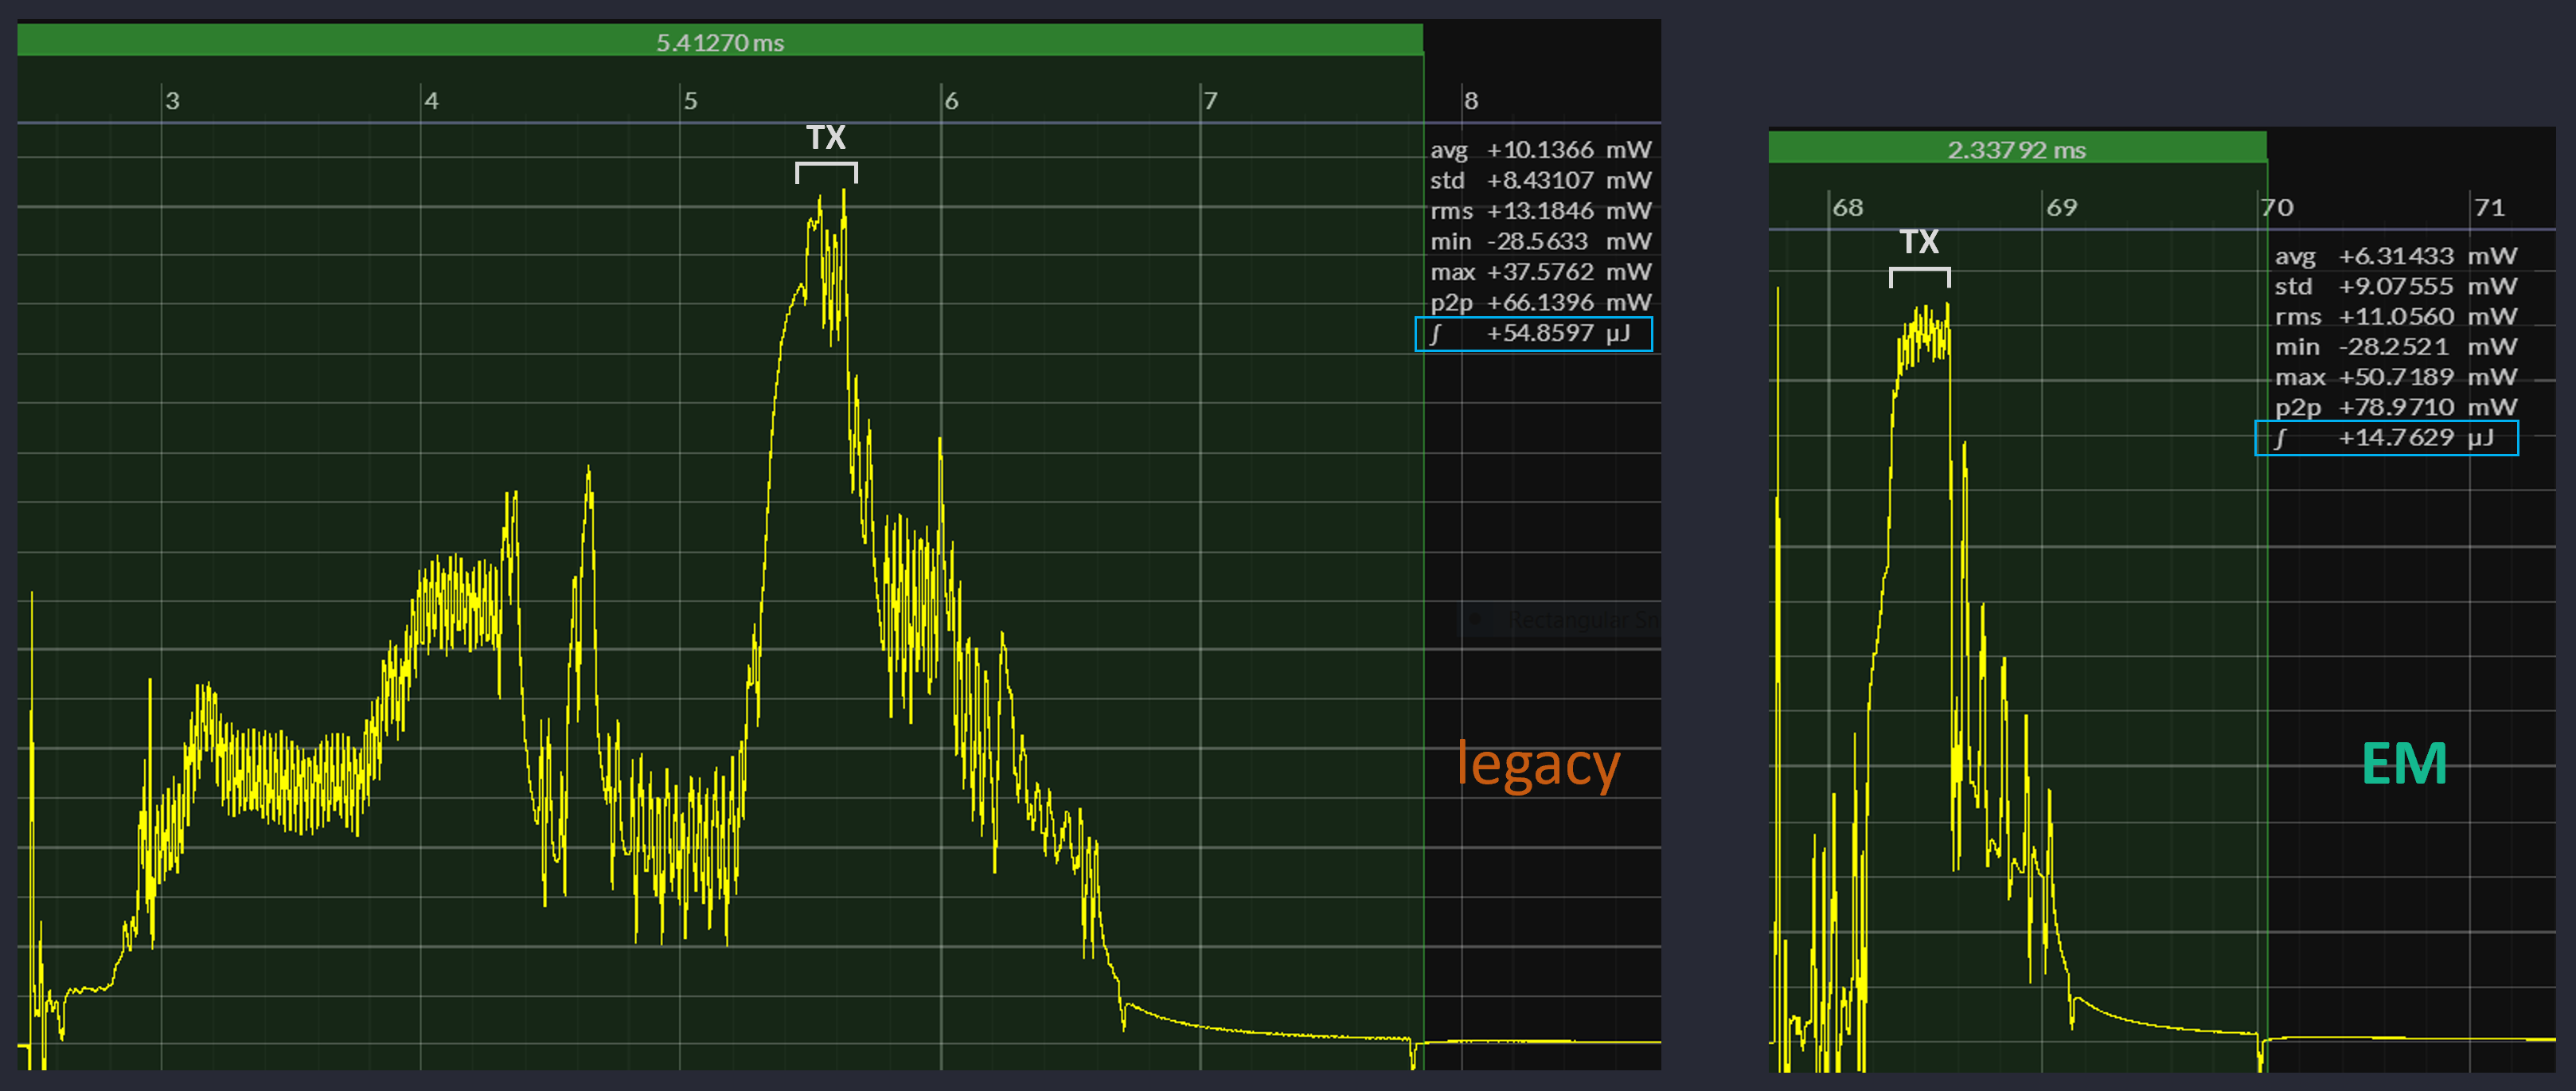
Inside a BLE advertising event [ wakeup → prepare → transmit → cleanup → sleep ] the actual packet TX window happens very quickly (~250 ms ). While transmit does draw more power (even with the CPU idling), prepare and cleanup times in fact dominate the μJ result.
Focusing on MCU power specs can blind us to the true impact of software on energy efficiency.
Performing the same BLE procedures almost twice as fast, the EM stack requires only 27% of the energy consumed by the legacy stack per advertising event. Another consequential factor here – a 200 K legacy stack versus ≤10 K of EM code executing entirely in fast SRAM !!!
code size does matter :: less code [ KB ] → less energy [ μJ ]
Follow us at blog.openem.org to learn more about EM's ability to boost energy efficiency.
What can you do to help
study – or in the worse case, just skim !! – this material on Measuring Energy
find some (human?) resource to help us migrate to the lower-cost STM32 Power Shield
show-and-tell the community about your own experience in measuring power consumption
Happy coding !!! 
