EM•Bytes · Quantifying energy efficiency with EM•Scope
 October 1, 2025 ·
  7 min read
Vendor data sheets might specify that an ultra-low-power MCU draws (say) 700 nA @ 3 V when in its "deep-sleep" mode. Very nice – but until we factor in our application workload, we have no way to truly assess the impact of these MCU specs on overall energy efficiency.
From power ( W ) to energy ( J )
Unless our MCU stays completely inert – awaiting reset in "shutdown" mode – embedded application software has undue influence upon system power consumption over time.
Consider a typical "ultra-low-power" wireless sensor tag – a class of embedded MCU applications which embody a relatively straightforward cyclic design pattern:
 wakeup from deep-sleep mode
 acquire data from the environment
 analyze this data using an algorithm
 transmit results (wirelessly) to a gateway
 re-enter (low-power) deep-sleep mode
With application requirements dictating periods of activity ranging from once-per-second down to once-per-day, minimizing elapsed time between steps through would surely lower total power consumption – by re-entering "deep-sleep" that much sooner.
In practice, steps and involve MCU peripherals performing I/O operations at application-defined data-rates – an ADC sampling at 15 kHz, a radio transmitting at 1 Mbps, etc. With little to do while awaiting I/O completion, software often idles within a "lite-sleep" mode.
Typical MCU power specs
MCU lite-sleep mode typically consumes under 1 mW of power and enables interrupt response times of less than 1 μs. But while the CPU idles, other peripherals such as the radio could remain active – in fact drawing more power than the CPU would alone.
By constract, MCU deep-sleep mode might consume well under 10 μW of power – but wakeup times could stretch to 100s of μs. While any active peripheral can awaken the CPU when idling, "deep-sleep" mode only powers a limited set of MCU elements (GPIOs, RTCs) which can trigger wakeup interrupts.
Finally, MCU active mode – when the CPU fetches and executes instructions – will typically draw power at levels expressed as μW / Mhz. Standard industry metrics like EEMBC CoreMark® help normalize performance claims by individual MCU vendors.
Once the MCU returns to its "active" mode – and the application finally does some useful work – the impact of software on total power consumption boils down to the number of instructions the CPU must fetch and execute. But how can we best quantify this impact ???
Joules, not Watts
As programmers, we must focus on power consumption over a period of time. Only then can we appreciate the oversized  impact our code might have on overall energy efficiency.
Profiling energy with EM•Scope
To bring energy efficiency into the foreground, we've introduced EM•Scope – a tool used to capture, analyze, display, and deliver real-time profiles of power-consumption.
Measuring target embedded systems performing typical periodic tasks, EM•Scope offers insights to developers and integrators alike not found in the MCU data sheet – by adding the dimension of time to the equation.
On a personal note
Back in the day, I never really worried about minimizing system power consumption when developing embedded application software. Instead, we fixated on maximizing processor utilization – using every available MIP to continuously perform a multitude of real-time tasks.
In my mind, the Texas Instruments MSP430 (announced in the 1990s) set the performance standard for the ultra-low-power microcontroller as we know it today. If nothing else, the MSP430 stands alone as the first MCU to use items from your fridge as a power source.
As a SW developer, the rules of the game have changed – to one in which "doing nothing" for the longest possible time maximizes overall energy efficiency. Yes, we still want to execute code as quickly as possible – but now to enjoy our "deep-sleep" that much sooner. 
EM•Scope captures real-time information via a hardware power analyzer connected to your target MCU board as well as your host PC:
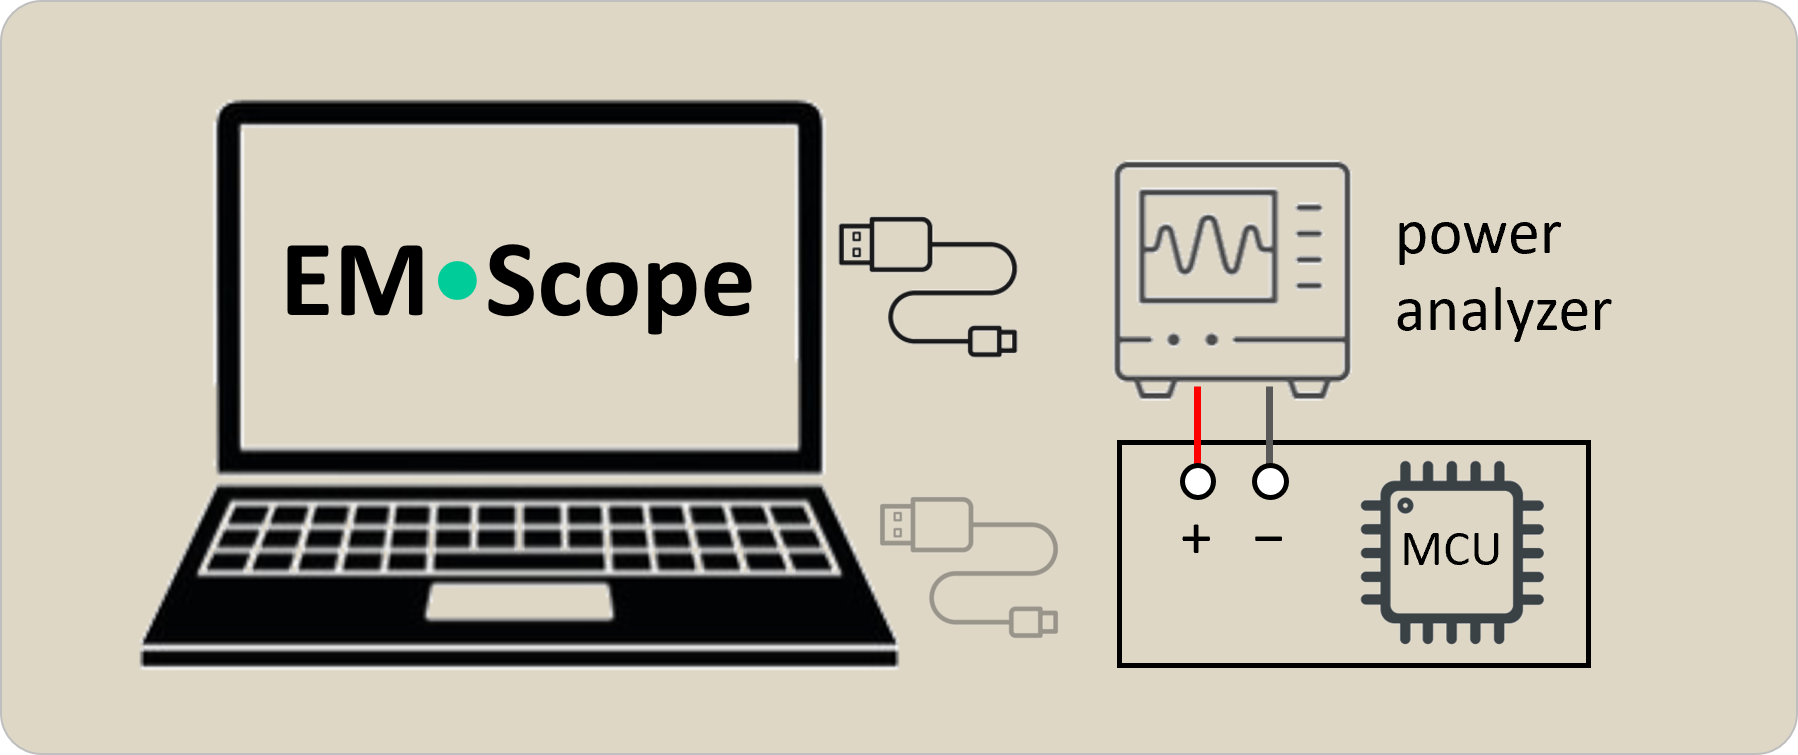
At present, the EM•Scope tool supports two different analyzers – each used to record power consumption in real-time while also sourcing voltage to your target board:
 Joulescope JS220 · a high-precision analyzer that belongs in every hardware lab
Nordic PPK2 · an entry-level analyzer that fits any engineer's personal budget
To normalize measurement, EM•Scope presumes your target board will repeatedly perform a single application task of interest – entering deep-sleep mode when complete, and awakening one-second later for the next iteration.
Breaking the problem down
While embedded applications typically perform multiple tasks (sensing, analyzing, logging, transmitting) at a variety of rates, measuring the power consumption of each task in isolation – akin to unit-testing – helps us construct an application-level power-profile
Knowing the 1 Hz energy profile of each task [ μJ/s ], we can extrapolate to other rates of activity as well as combine results to characterize the application as a whole. Individual tasks, while active less than 1% of the time, can often account for over 90% of the μJ/s.
Since periodic activity occurs once per-second, recording for as little as 10–15 seconds should provide a reasonable raw sample set for further analysis. Often an iterative process to finalize results, EM•Scope can generate interactive plots along the way as a visual aid:
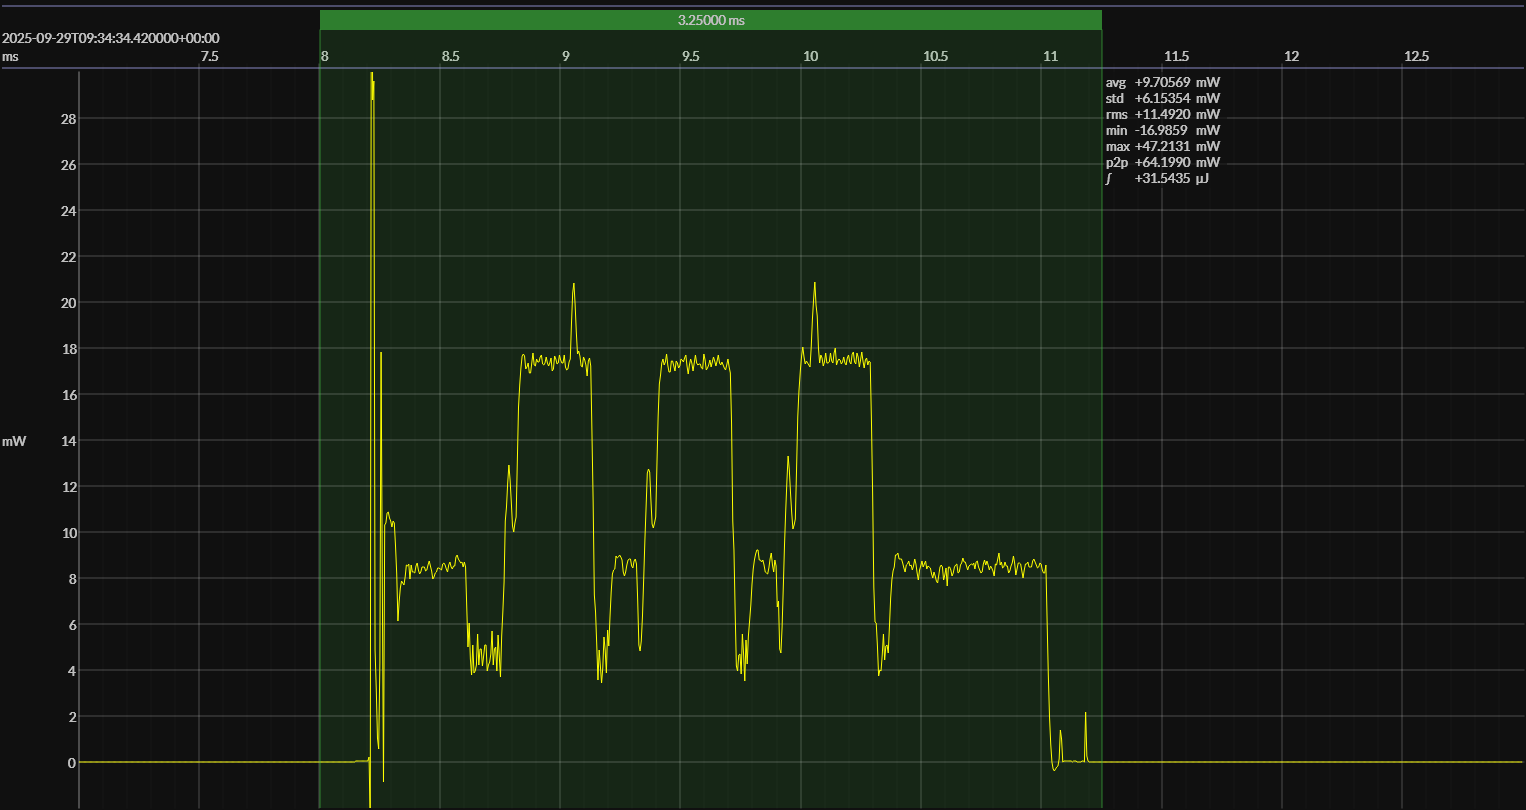
This particular plot displays power consumption of a single activation of our application task of interest – in this case, a Bluetooth Low-Energy (BLE) advertising event which transmits the same small data packet on three different 2.4 GHz channels.
Though not obvious, the trio of 300 ms radio transmissions drawing 18 mW accounts for less than half the power consumed between wakeup and sleep. Closer scrutiny revels that software execution (while only drawing 8 mW) has greater impact on the overall power profile.
If you can't see the problem, how can you fix it ??
Visualizing power consumption over time with EM•Scope gives software engineers a better perspective on how optimizing their code can contribute to overall energy efficiency – independent of any improvements in the underlying hardware technology.
Quantifying energy efficiency
In the spirit of CoreMark (used for comparing CPU performance) EM•Scope introduces a new single-score metric for quantifying energy efficiency – the EM•erald. Like other benchmark scores, "higher is better" – more EM•eralds means less power and greater efficiency.
Starting with a baseline measurement of μJ/s using (say) ten 1 Hz wakeup · execute · sleep cycles, we can easily calculate J/day. In our earlier example, EM•Scope determined that a complete one-second cycle consumed 33.913 μJoules which scales to 2.930 Joules per day.
By measuring power consumption when in deep-sleep, EM•Scope can calculate J/day for periodic activity occuring at any rate. If the BLE advertising event seen earlier happened once every ten seconds, this task would now require only 0.463 Joules per day of energy.
Can we harvest our daily energy needs ??
Vendors of energy-harvesting components will commonly characterize their offerings in terms of J/day (or mWh/day). By making this figure readily available, EM•Scope enables us to quickly determinime the viability of a particular solution.
Since our application likely performs multiple activities at different rates, a simple sum of J/day results derived from benchmarking each activity in isolation provides a reasonable model of overall energy consumption within the application as a whole.
Knowing J/day, we'll calculate our final EM•erald score using a constant which approximates the energy capacity of a standard CR2032 coin-cell battery:
 EM•eralds = 2400 / (Joules-per-day × 30) = 80 / Joules-per-day
CR2032-capacity : 225 mAh × 3.6 × 3.0 V ≈ 2.43 kJ
1 EM•erald ≈ 1 CR2032-month
Returning to our example: BLE advertising at a one-second rate scores 27.30 EM•eralds; BLE advertising at a ten-second rate scores 172.31 EM•eralds. As the duration of the period further increases, our BLE advertising score asymptotically approaches ~420 EM•eralds.
This particular example uses an MCU(1) which features extremely low current consumption when in deep-sleep. While by no means the winner in a 1 Hz race, this chip pulls away from the competitition(2) once we throttle back to (arguably) a more realistic rate of activity.
- Texas Instruments CC2340R5
- Nordic nRF54L15, Silicon Labs ERF32BG22E
The gold standard — “five years on a coin-cell” ≡ 60 EM•eralds
Even if your ultra-low-power embedded application has different requirements for longevity and employs different sources of power, EM•Scope helps developers continually mine their target system for more EM•eralds.
Learning more about EM•Scope
The EM Foundation makes EM•Scope openly available on GitHub, where you'll find this extended ReadMore file covering installation and usage of the tool. Even if you don't plan to work with EM•Scope in the near-term, at least skim through its documentation.
We've also made available the em-foundation/BlueJoule repository housing power profiles captured by others – including the BLE example seen earlier. You need not invest in a HW power analyzer to learn more about the benefits EM•Scope offers to SW developers.
Happy coding !!! 
